Birth of the Desire Scale and a Simple Data Grouping
Amazingly Secret Approach Using an Incredibly Novel Data Analysis Procedure for Comic Book Investing and Speculation.
This post is an introduction to the concept of the B Score data as a beginning to lead to the labeling of each issue in the 10 runs I have covered with a Desire Scale and a Simple Data Grouping. I copied the top comic book issues that had a B Score of 200 and above. I needed to transform the data to help me visualize the group. I tried log transformation and did not use it. I instead scaled the data and used the transformed data as a guide to separate the issues into groups. The five tables denote the grouping from A to I issues.
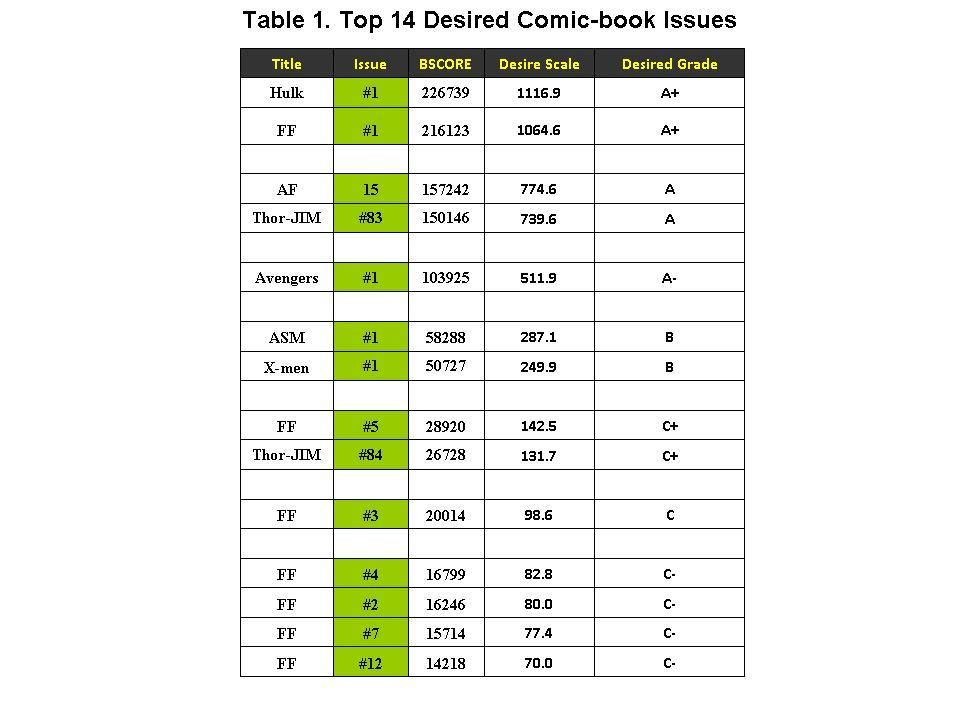
The scale number means that you can use that number to compare two issues. For example Hulk 1 1117 vs JIM 84 132. Divide 1117 by 132 yielding 8.4. Thus on average Investors Desire Hulk #1 8 times as much as JIM #84. The most surprising to me was the strength of FF#5 as the top non number 1 issue. Investors are very bullish on the first appearance of Doctor Doom (FF#5) vs say the first appearance of Loki in JIM 85. (142.5 divided by 46) by a 3 times more desired level. Interesting!
The color markings on the issue numbers are a carry over from the B Score rating within the group. Note in Table 2 the two FF have a lower rating as colored by dark green. So that means that within FF only that ranking is true but when thrown out in the mix I would consider them very high targets. About at #86 do we see a shifting into the dark green stained issues.
Last point is go over these data and learn. I has occurred to me that if you used a price guide or auctions averages and assigned those values on all these issues, overlays will jump out to you. A issue that is cheaper but desired higher then a more expensive issue is a strong "buy". I used the letters to acknowledge data is best thought of in group. That adds a looseness to the analysis.
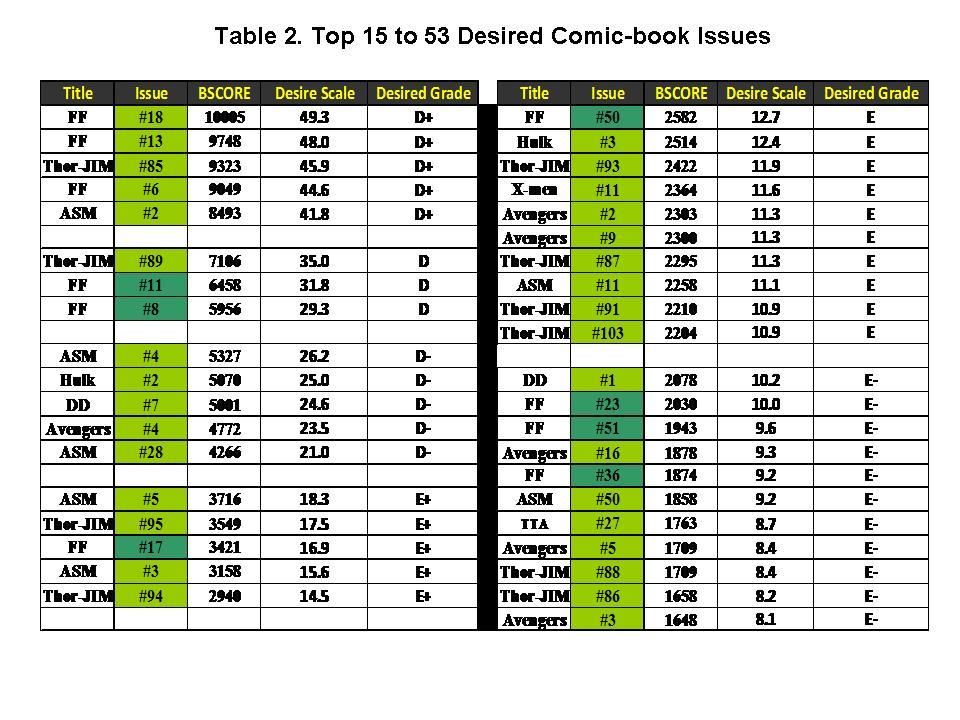
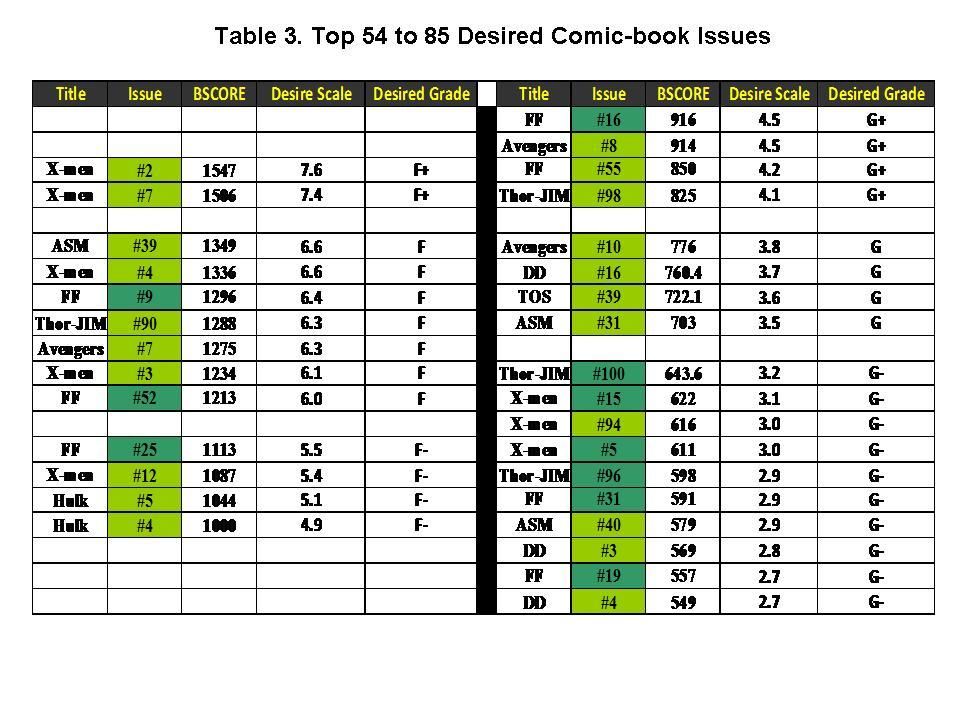
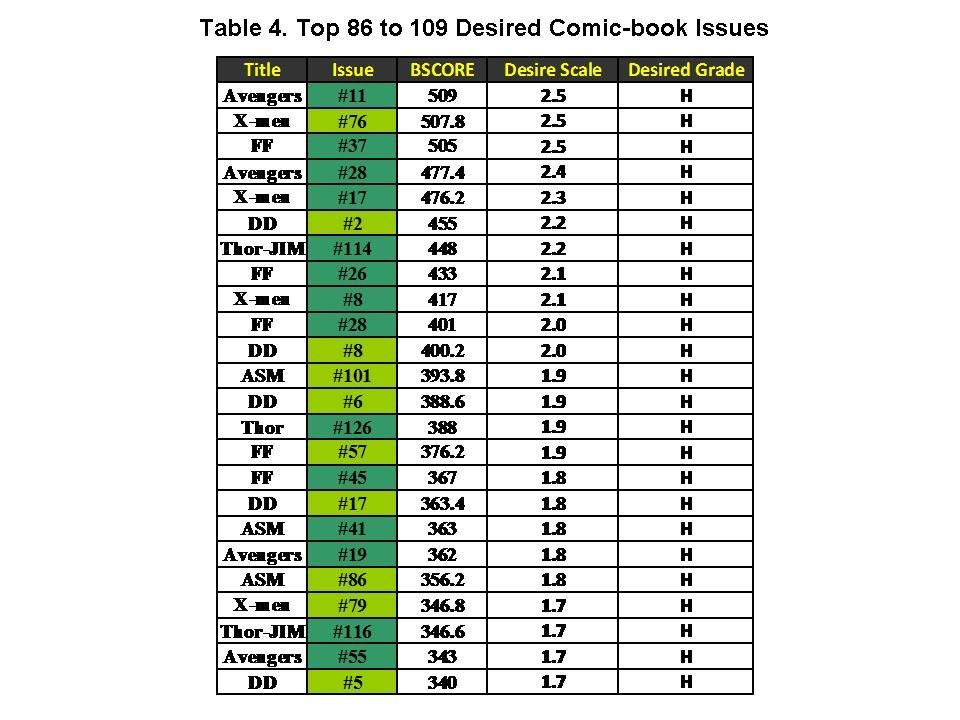
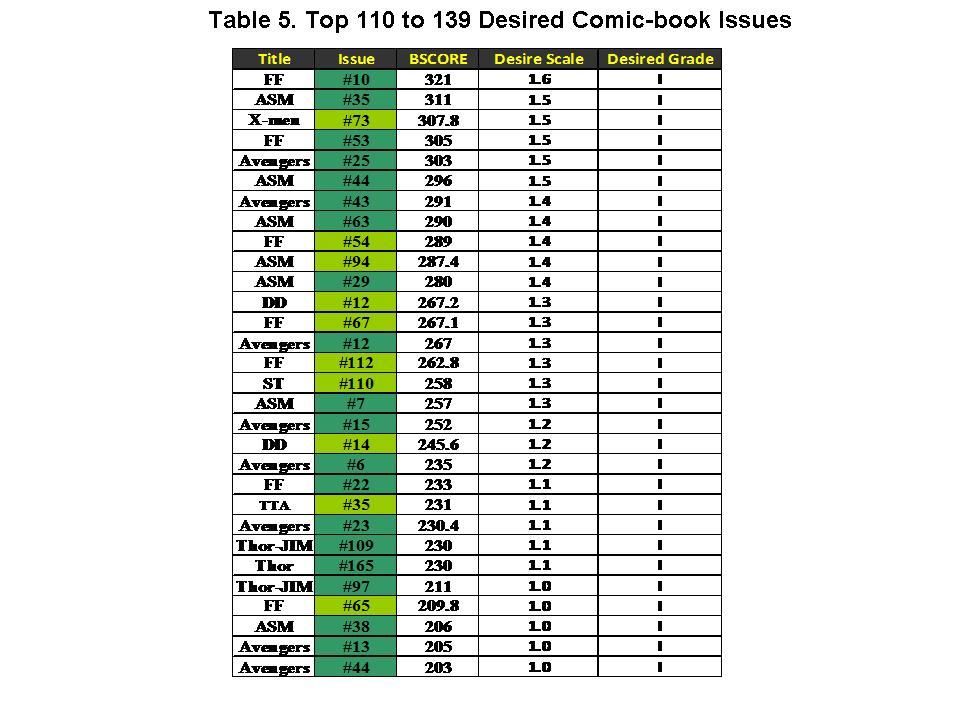
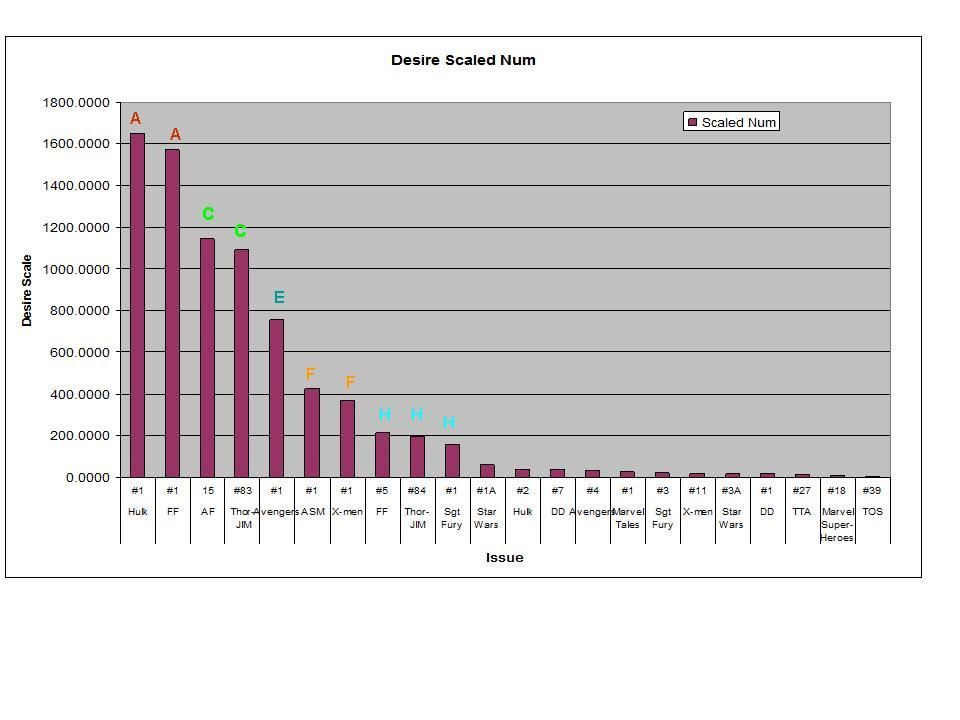
I have update this draft before publishing it. I have 1356 issues in my data base (more coming including DC comics down the road) and this shows the position of the first 2 of the the titles I have done. I skipped issues and only come show these certain ones. It show the scale and the distribution of the desire scale. Very skewed. The same letters show similar desired issues. IE Hulk 1 and FF 1 are too close to call consider it a tie as is AF 15 and JIM 83 as well. Neat to see the Star Wars 1A price variant in this rare group. Heavily desired! Note DD#7 vs DD#1 interesting difference. I will be curious where some of the KEY DC silver age issues fall against the Marvel Issues. If you have not figured it out, this data is unique and not available anywhere else! Enjoy!
This post is an introduction to the concept of the B Score data as a beginning to lead to the labeling of each issue in the 10 runs I have covered with a Desire Scale and a Simple Data Grouping. I copied the top comic book issues that had a B Score of 200 and above. I needed to transform the data to help me visualize the group. I tried log transformation and did not use it. I instead scaled the data and used the transformed data as a guide to separate the issues into groups. The five tables denote the grouping from A to I issues.
The scale number means that you can use that number to compare two issues. For example Hulk 1 1117 vs JIM 84 132. Divide 1117 by 132 yielding 8.4. Thus on average Investors Desire Hulk #1 8 times as much as JIM #84. The most surprising to me was the strength of FF#5 as the top non number 1 issue. Investors are very bullish on the first appearance of Doctor Doom (FF#5) vs say the first appearance of Loki in JIM 85. (142.5 divided by 46) by a 3 times more desired level. Interesting!
The color markings on the issue numbers are a carry over from the B Score rating within the group. Note in Table 2 the two FF have a lower rating as colored by dark green. So that means that within FF only that ranking is true but when thrown out in the mix I would consider them very high targets. About at #86 do we see a shifting into the dark green stained issues.
Last point is go over these data and learn. I has occurred to me that if you used a price guide or auctions averages and assigned those values on all these issues, overlays will jump out to you. A issue that is cheaper but desired higher then a more expensive issue is a strong "buy". I used the letters to acknowledge data is best thought of in group. That adds a looseness to the analysis.


I have update this draft before publishing it. I have 1356 issues in my data base (more coming including DC comics down the road) and this shows the position of the first 2 of the the titles I have done. I skipped issues and only come show these certain ones. It show the scale and the distribution of the desire scale. Very skewed. The same letters show similar desired issues. IE Hulk 1 and FF 1 are too close to call consider it a tie as is AF 15 and JIM 83 as well. Neat to see the Star Wars 1A price variant in this rare group. Heavily desired! Note DD#7 vs DD#1 interesting difference. I will be curious where some of the KEY DC silver age issues fall against the Marvel Issues. If you have not figured it out, this data is unique and not available anywhere else! Enjoy!


This comment has been removed by a blog administrator.
ReplyDelete