SECOND ARC BEGINS____ Investment Potential and Bias Analysis of Captain America Issues 100 to # 118
Amazingly Secret Approach Using an Incredibly Novel Data Analysis Procedure for Comic Book Investing and Speculation.
Analysis of Early Captain America Issues 100 to 118.
Analysis of Early Captain America Issues 100 to 118.
This is the beginning Blog Arc for the next group of Marvel
Titles to look at. I have eased over in the bronze era as well.
Captain America issues 100 to 118,
Sub-mariner 1 to 20, 22, 34 to 36 and 43.
Defenders 1 to 19,
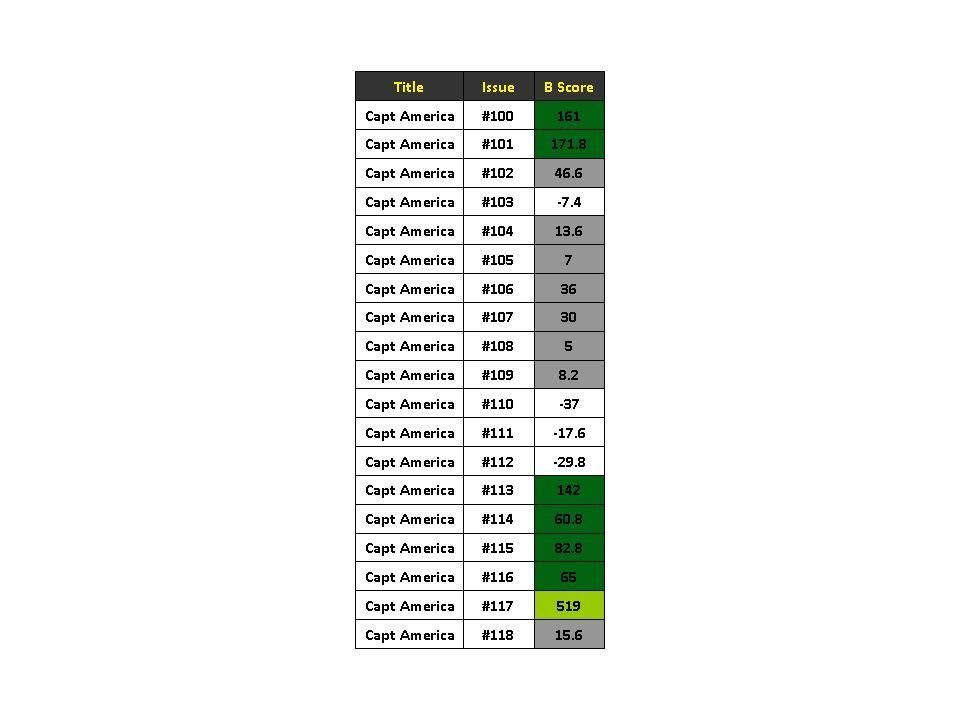
Iron Man 1 to 56,So given the interest in the recent movies, I suspected these issues would be strong buys. As discussed before the Bias Scores gives us a first top down view into these issues. Looking at table 1, green denoted issues are those issues biased supported by the insider investors and are recommended as buy candidates. The only light green issue #117 is the first appearance if the Falcon. Note its B Score is 519 that puts it in the top 85 silver age issues for desirability. That is a strong strong number. See the data in the Desire Scale Blog Post. I will be referring back to that to put context for you. The dark green denoted issues are 100, 101 and 113. Their B Scores place them out of the top groups. Note the negative and gray issues. Looks like some overbuying by the Outsiders here.
Table 1 the B Scores for CA #100 to 188
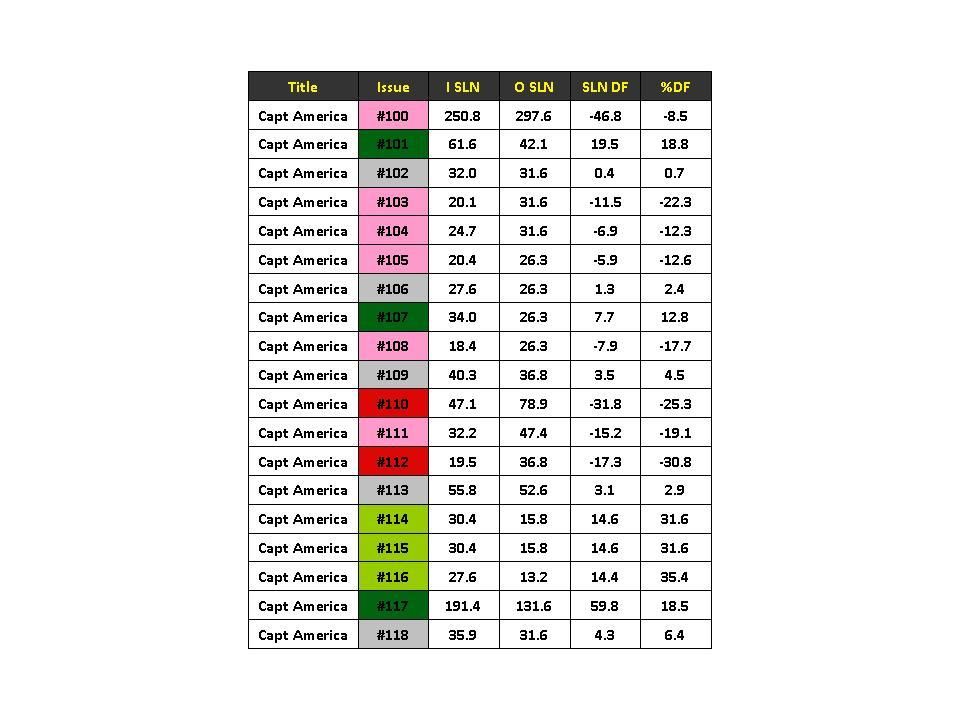
We now move deeper into our analysis. I use the SLN number
as a way to look across 3 grades of comic-book condition (9.4, 8 and 6) in each
Bias World. Insider’s SLN numbers
measure strength across the grades as seen by the insider investor. We compare the Insiders and Outsiders and get
a simple difference number (SLN DF) and get %DF for that issue. % DF measures
how much does that DF between represent of the total SLN numbers. For instance
in issue 100, %DF = (SLN DF/(I SLN + O SLN))*100 is -8.5% not a good score.
Negative numbers move the attention into the Outsiders camp. In Table 2, the green stained issues
represent strong differences and show the Insiders are favoring 101, 107, and
114 to 117. Red stained issues are the
opposite types and are pointing to avoid those issues. Gray stained issues are neutral signaled
issues and are on the watch list.
Table 2. SLN Numbers in these issues
Ok next is hopefully the deep data we need to make final
conclusions. I generate the differences
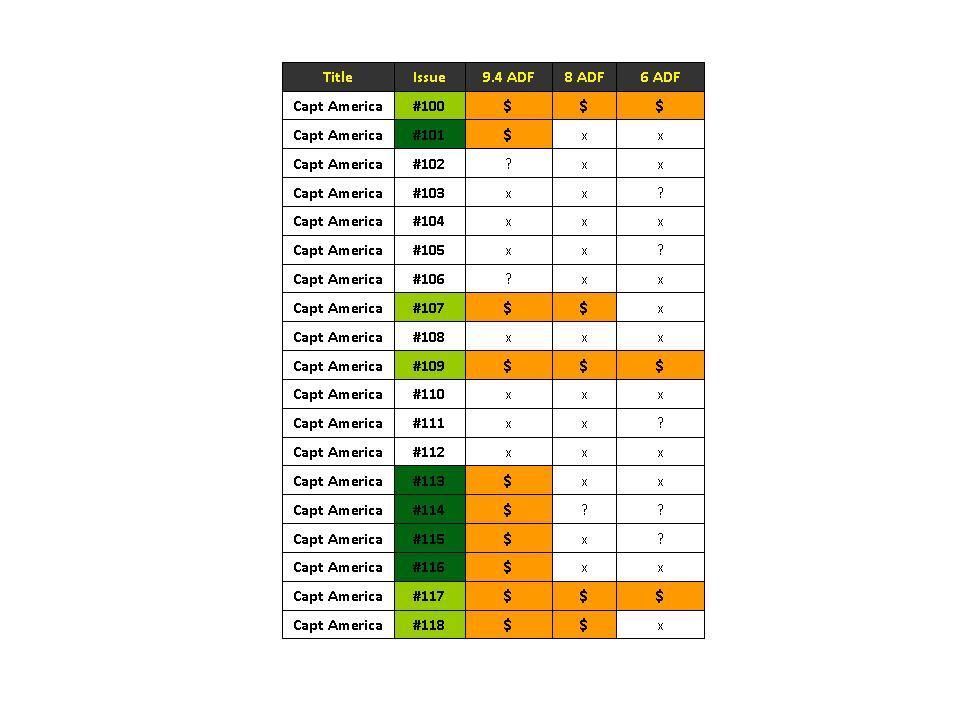
not by I vs. O but by grades (9.4, 8 and 6). I have stained the Grade Grid with
$ (orange- favorite color) and stained I favored issues green with the light
green issues being the strongest I biased across multiple grades. Therefor
those issues are a buy across the 3 grades while the dark green ones are only
signaled as buys at the highest grade of 9.4. So the light green stained issues
(strong buy issues) are issues 100, 107, 109, 117, and 118. I am glad to see that issue 117’s data is
across the board here. About 60% of this run is a buy at 9.4 fyi. Please see
the blog advice on price points etc. for the complete story for investment
buying. I use this chart but have now
been adding the Score Card data as a “look across the landscape” view in this run
as well. See Table 4.
Table 3 the ADFs at grades 9.4, 8 and 6.
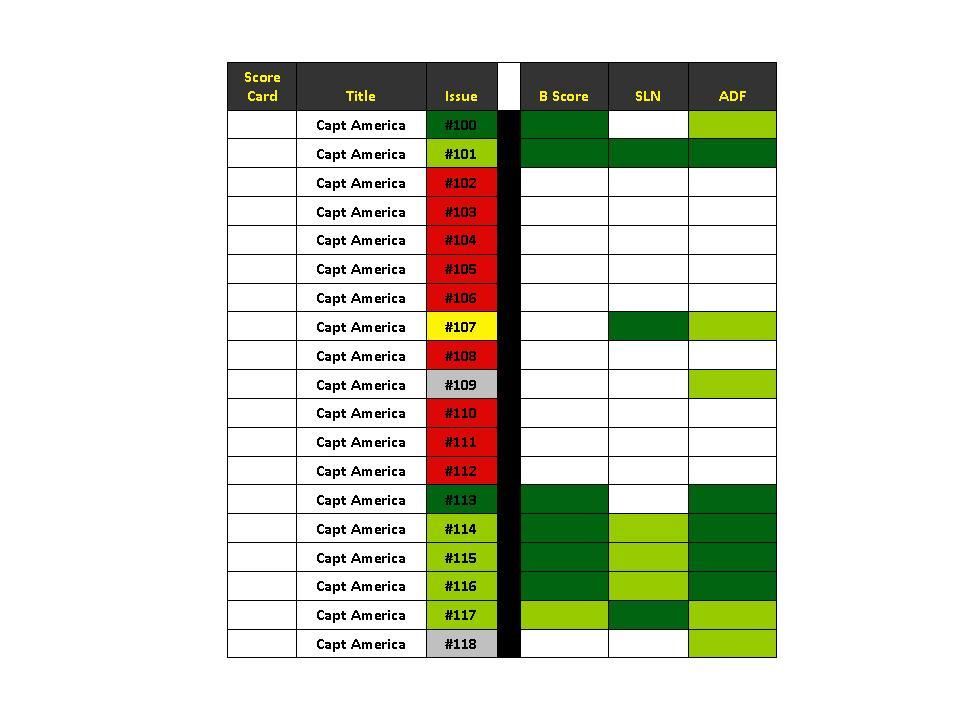
So looking at Table 4 the scorecard data gives me a big view
from above at the preceding data grids. I have stained the issues light green
for those issues favored across the 3 data streams, dark green for favored by 2
data streams and a grey points out issues favored only in one. Yellow are
interesting issues to watch. Red issues are not favored. I think 117 is the “got to buy” in this group
given the B Score and its Desire rating of 85 or so. You could be more generous with your price
points if you wish for this issue. The
others would be only considered under very favorable conditions (Good price to
buy). I would not reach for the rest of the greens unless you got to.
Table 4. Score Card for CA Issues #100 to 118.
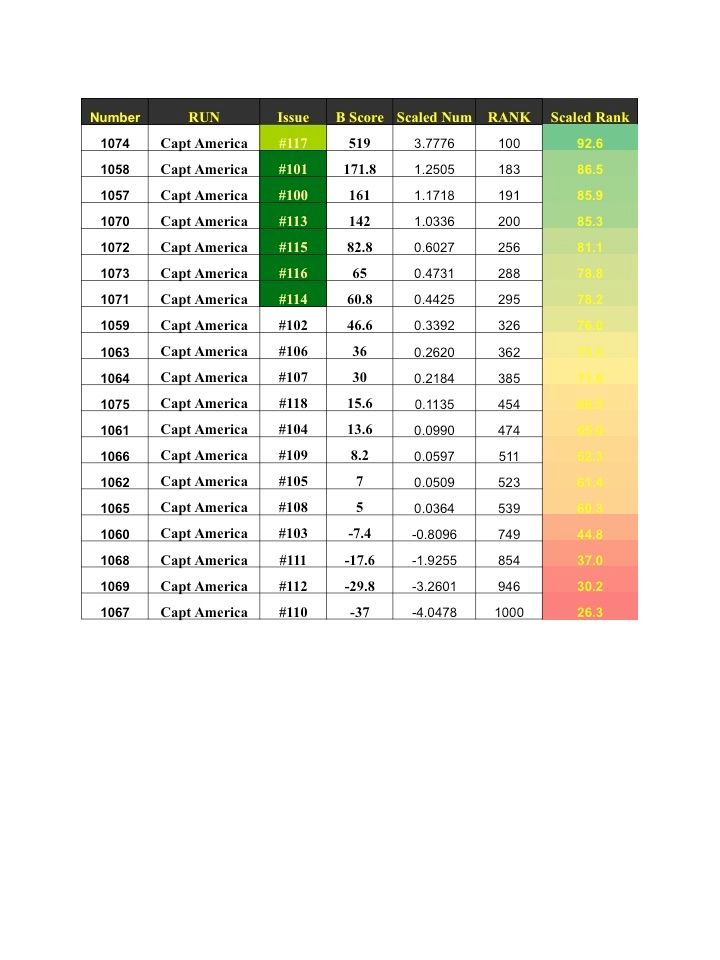
So I have added some data I call the Desire Scale when I have groups 1356 issues and compared the Desire Level os each issue. I have included a Heat map of the Scaled Rank. Issue 117 is desired in the top 9% of all comics I have studied so far. So using the Scaled Num we can compare 2 issues 117 (3.77) vs 100 (1.17). Divide 3.77 by 1.17 and thus the Issue 117 is desired 3.2 times as much as Issue 100. Play with the data. Enjoy.
Table 5 Desire Scale for Captain America Issues.
Comments
Post a Comment